
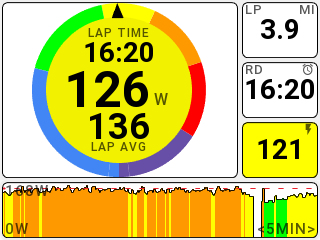
Power is displayed as a bar colored by your personal training zones. The default scale of the power graph field is FTP + 10% to optimize the graph.
| POWER ZONE COLORS | |
|---|---|
| Zone | Color |
| Zone 1 | Blue |
| Zone 2 | Green |
| Zone 3 | Yellow |
| Zone 4 | Orange |
| Zone 5 | Red |
| Zone 6 | Purple |
| Zone 7* | Pink |
*Stages default power includes 6 zones, but more can be added when zones are customized in the Stages Cycling app.
FTP is shown on the graph as a dotted line. If the power output exceeds FTP+10%, the graph will adjust the scale to match the max value in the current span.
When that value is no longer displayed, as graphing data is replaced in a fixed span, the graph will readjust its scale to return to either the max power value or to FTP+10%.
