
Elevation graphs display a dynamic scale that is either the minimum recorded elevation for the current span plus 100 feet, or the minimum to maximum elevation range if an ascent exceeds 100 feet. This ensures that when the elevation delta is small, the slopes displayed in the graph are not excessively steep for very small changes in elevation.
Here are some examples of the elevation scale:
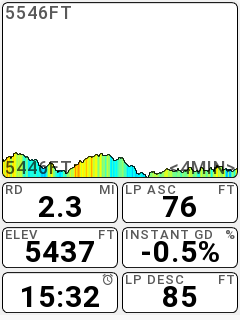
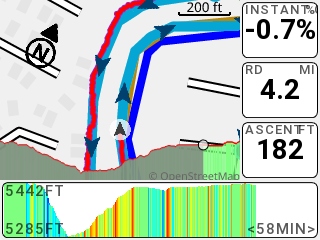
Bars in the elevation graph are colored according to the gradient at that time.
