
Graphs can be added to any data page, in any size field, for the following metrics:
Metrics are displayed as the vertical axis of a graph, while the horizontal axis represents the designated span—either a fixed amount of time, designated lap, or the duration of a ride.
To add a graph to any page, go to the Edit data pages menu on the Dash or in Stages Cycling app. Select any existing page or start a new page to add graphing to. Up to 20 graphs can be added to a profile.
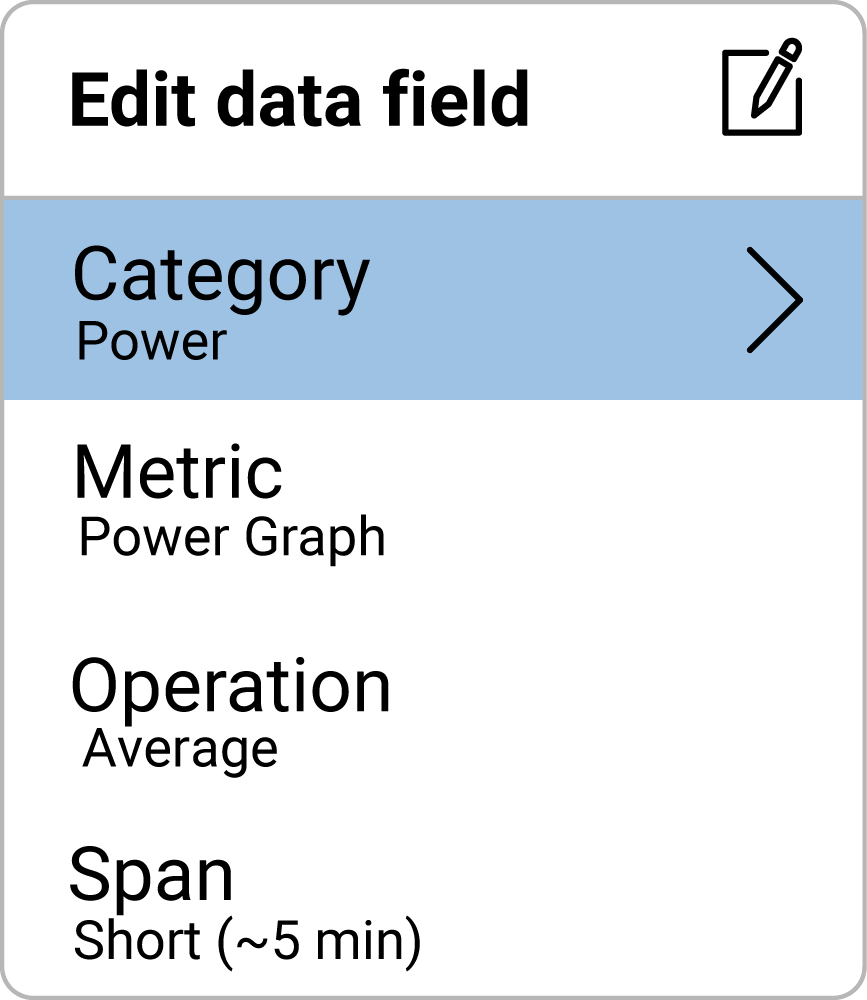
Graphs are based on either fixed or dynamic time spans, each of which has different behaviors.
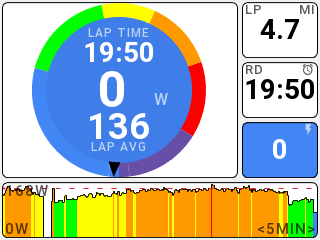
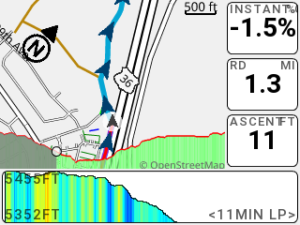
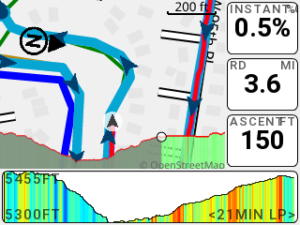
Graphs can be set to approximately 5, 20, or 60 minutes; which are fixed time spans. These spans are approximations, as they vary slightly based on the width (number of pixels) of the field. These graphs show a rolling window of data, and the time span is indicated in the top left of the field.
Fixed span graphs will start by filling in the graph from left to right as ride time passes.
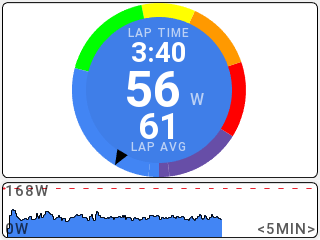
When ride time is greater than the span, new data is shown on the right side of the screen, replacing data on the left side of the screen.
Graphs can be set to display an entire lap or ride. As time passes and the graph reaches the end of the data field, the time span will adjust to allow for more data to be shown in the field.
The last lap span will allow you to display a static graph containing data for the chosen metric from your last lap. This can be useful for viewing efforts after they are completed.
